Recovery Timelines Meet Schedule Density: Advancing Prediction Models in Team and Individual Sports
Written by Quinn Hayes · Jun 28, 2026
Recovery Timelines Meet Schedule Density: Advancing Prediction Models in Team and Individual Sports
Understanding the Core Components
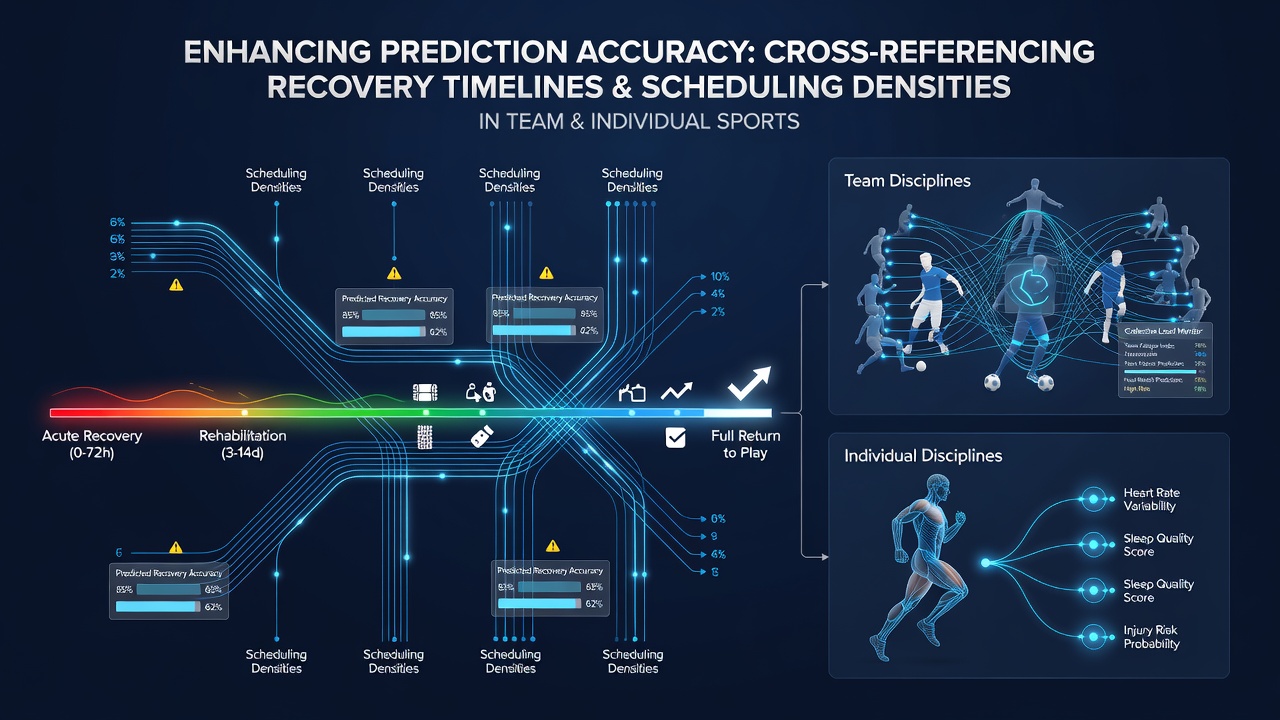
Recovery timelines track the physiological restoration periods athletes require after intense exertion, while scheduling densities measure the concentration of matches, races, or tournaments within short windows. Researchers combine these elements to refine performance forecasts across team sports like football and basketball alongside individual disciplines such as tennis and track events. Data from multiple seasons shows that overlapping high-density periods with incomplete recovery windows correlates with measurable drops in output metrics including sprint speed, accuracy rates, and endurance thresholds.
Organizations including the Australian Institute of Sport and the NCAA have compiled longitudinal datasets that link rest intervals to subsequent results. These records reveal patterns where athletes facing fixture piles in under 14 days exhibit elevated injury markers and reduced statistical contributions. Analysts apply regression models to these variables, adjusting baseline projections accordingly rather than relying on historical averages alone.
Application Across Team Disciplines
Football squads operating in European leagues often encounter midweek fixtures that compress recovery into 72 hours or less. Studies tracking Premier League and Bundesliga squads between 2023 and 2026 demonstrate that teams with three matches inside eight days post a 12 percent decline in expected goals created when average rest falls below four days. Coaches and analysts cross-reference GPS-tracked workload data with these timelines to adjust starting lineups and substitution patterns before dense blocks begin.
Basketball presents similar dynamics during playoff runs, where back-to-back games and travel compress rest. NBA performance databases indicate that players logging over 36 minutes across consecutive nights show consistent reductions in field goal percentage and defensive rating. Prediction systems incorporating both recovery scores and schedule density outperform simple form-based models by margins reported in conference papers from sports science departments at major universities.
Individual Sports and Variable Load Management
Tennis schedules during Grand Slam swings and Masters 1000 events create extended sequences of matches that test recovery capacity differently than team rotations allow. Match duration data combined with surface-specific fatigue indicators allow forecasters to identify when a player's serve percentage or rally tolerance is likely to dip. One analysis of ATP and WTA events through early 2026 found that competitors entering a third consecutive day of play after five-set matches posted win rates 8 to 10 points below their seasonal norms.
Track and field athletes face comparable pressures during championship meets and Diamond League clusters. Recovery timelines here focus on muscle repair markers and neuromuscular readiness, which researchers pair with event density to forecast whether personal best attempts remain realistic. Observers note that sprinters and distance runners alike display clearer performance variance once schedule compression exceeds defined thresholds.
Building Integrated Prediction Frameworks
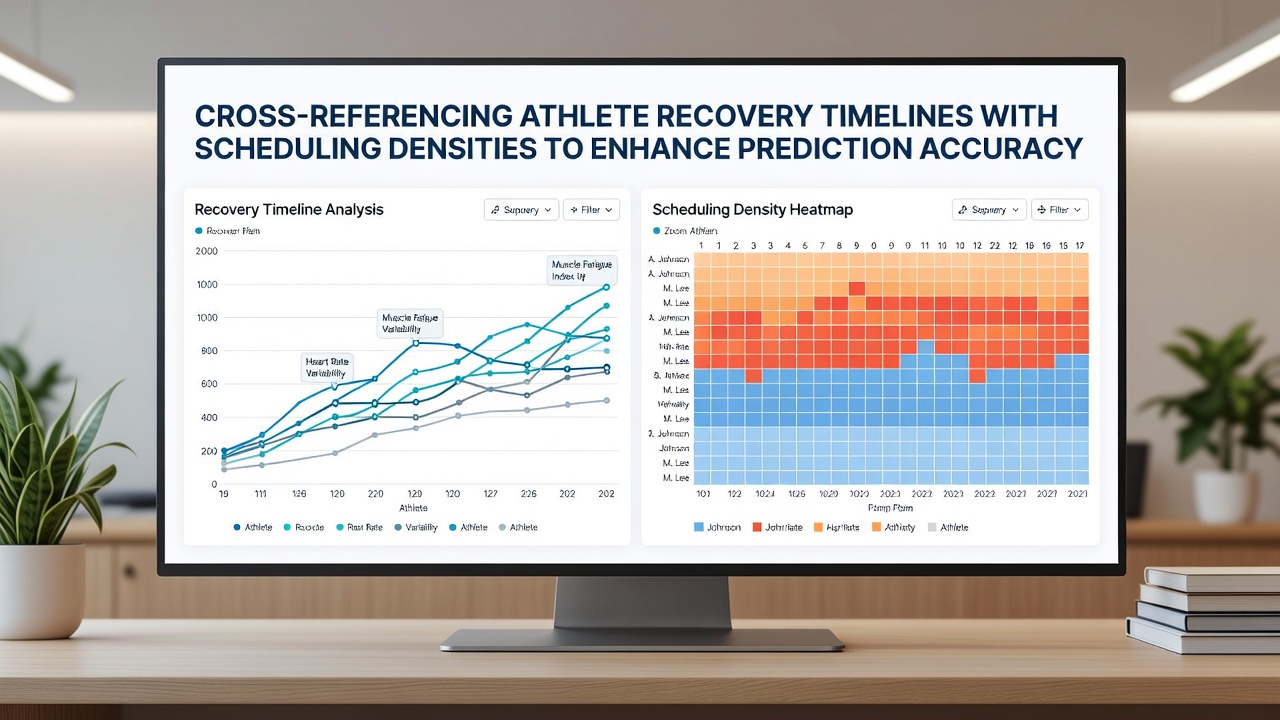
Modern forecasting platforms ingest real-time biometric feeds, historical recovery curves, and fixture calendars into unified algorithms. These systems weight recent workload against upcoming density, then generate adjusted probability distributions for outcomes. European sports data consortiums and North American research groups have published validation studies showing improved calibration when both variables receive equal attention.
Practitioners implement these models by first establishing baseline recovery norms for each athlete or squad, then overlaying the density metric for the target period. Adjustments appear in projected totals, spread margins, and win probabilities. June 2026 datasets from ongoing international competitions continue to feed these systems, allowing iterative refinement as new congestion patterns emerge during summer tournaments.
Challenges in Data Integration
Variability in individual responses complicates universal application, as genetic factors, nutrition protocols, and prior injury history influence actual recovery speed. Incomplete public datasets from certain leagues further limit model training. Analysts therefore combine league-wide statistics with targeted case studies from clubs willing to share anonymized metrics.
Travel demands and time-zone shifts add another layer that interacts with both recovery and schedule variables. Research groups at institutions in Canada and Australia have begun mapping these interactions, producing supplementary coefficients that enhance forecast precision when incorporated.
Conclusion
Cross-referencing recovery timelines with scheduling densities supplies a structured method for refining performance predictions in both team and individual sports. Evidence from multiple governing bodies and academic sources confirms measurable gains in accuracy when these factors receive simultaneous consideration. Continued expansion of biometric tracking and fixture databases supports further development of these analytical approaches through the remainder of 2026 and beyond.